01
Attendance dashboards
Who was here, by building, by grade, by day — the same view for every school in the district.
Kansas district data · Wichita
Attendance dashboards, assessment trends and early warning alerts for every building you run — assembled from the files your district already keeps.
Attendance dashboards
Assessment trends
Early warning alerts
State reporting
Data cleaning
Board-ready exports
01 — What we build
Attendance, assessment, alerts, reporting, cleaning and board exports — built on the files you already keep, and read at the same distance for every school in the district.
01
Who was here, by building, by grade, by day — the same view for every school in the district.
02
The same assessment read across terms, instead of one testing window at a time.
03
Flags raised when attendance and assessment move the wrong way together.
04
The state’s file layout, filled from the same cells you already keep.
05
Duplicates, missing days and mismatched student IDs, straightened out before anything is reported.
06
One page a board can read at a glance, drawn from the same cells as everything else.
02 — How a demo runs
An attendance export, an assessment file, a state reporting template — whatever you already have open.
Duplicates, missing days and mismatched student IDs get sorted before anything lands in a dashboard.
Each school takes its own cell, each day its own row, so the whole district reads at once.
Dashboards, alerts and a board-ready export, walked through with you on the call.

03 — From further away
Once the daily record is already on the grid, the state’s reporting layout and the board’s summary are the same data read from a different distance. Nothing gets rebuilt by hand.
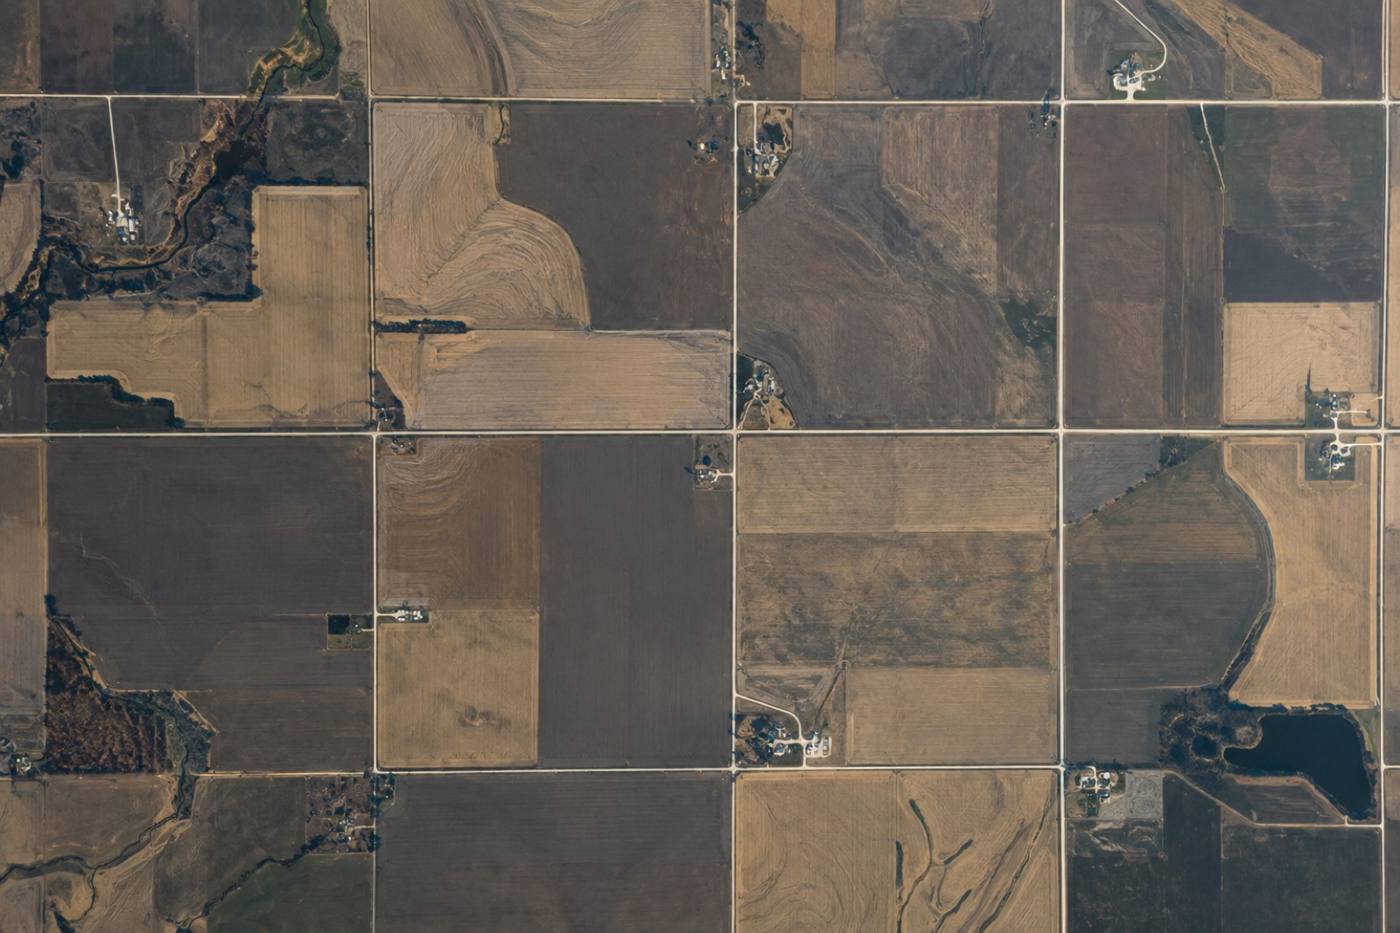
A district is a grid of buildings and days. Most of the tools we see ask you to hold that grid in your head. We would rather put it on the page.
Live demo
Tell us the district and a work email. Bring an attendance export or a state reporting template, and we’ll work from it on the call.
Nothing to install
Wichita, Kansas