01Traces
Follow one request all the way down.
The distributed tracing SDK captures every hop a request takes — edge, service, cache, query — and shows you where the time actually went.
Span tree · one request, every hop
Boulder, Colorado · Distributed tracing & observability
Your system is already talking. Nightjar Labs collects the traces, logs and alerts your services emit — and keeps every byte inside your own infrastructure.
Install the SDK
$ curl -sSL https://nightjar.dev/install | sh
OpenTelemetry-native · runs on your hardware
Channels
Every service you run broadcasts on all three at once. Nightjar listens to each band separately, then lines the calls back up into a single story.
The distributed tracing SDK captures every hop a request takes — edge, service, cache, query — and shows you where the time actually went.
Span tree · one request, every hop
A log pipeline that ingests, parses and routes what your services emit, so the line you need is sitting there when a request goes quiet.
collector pipeline=traces acceptedlevel=warn service=api latency budget exceededlevel=info service=worker batch flushedlevel=error service=search upstream timeoutLog stream · structured, routeable
Uptime alerting watches the shape of your traffic instead of the noise, so the page lands when a service truly goes quiet — not every time a metric twitches.
Uptime · threshold and quiet


Why Nightjar
Distributed systems don't fail loudly. They go quiet in one place, get slower in another, and drop the thread somewhere in between. Nightjar Labs gives platform teams one place to listen for all of it.
Everything is OpenTelemetry-native and self-hosted, so the pipeline runs inside the same walls as your services. No agent phones home. Nothing leaves your infrastructure.
Self-hosted
Self-hosted from the first packet. One command puts the SDK and the pipeline in your infrastructure, then stays out of the way.
A single command wires the tracing SDK into your services and points your existing OpenTelemetry collector at the Nightjar pipeline.
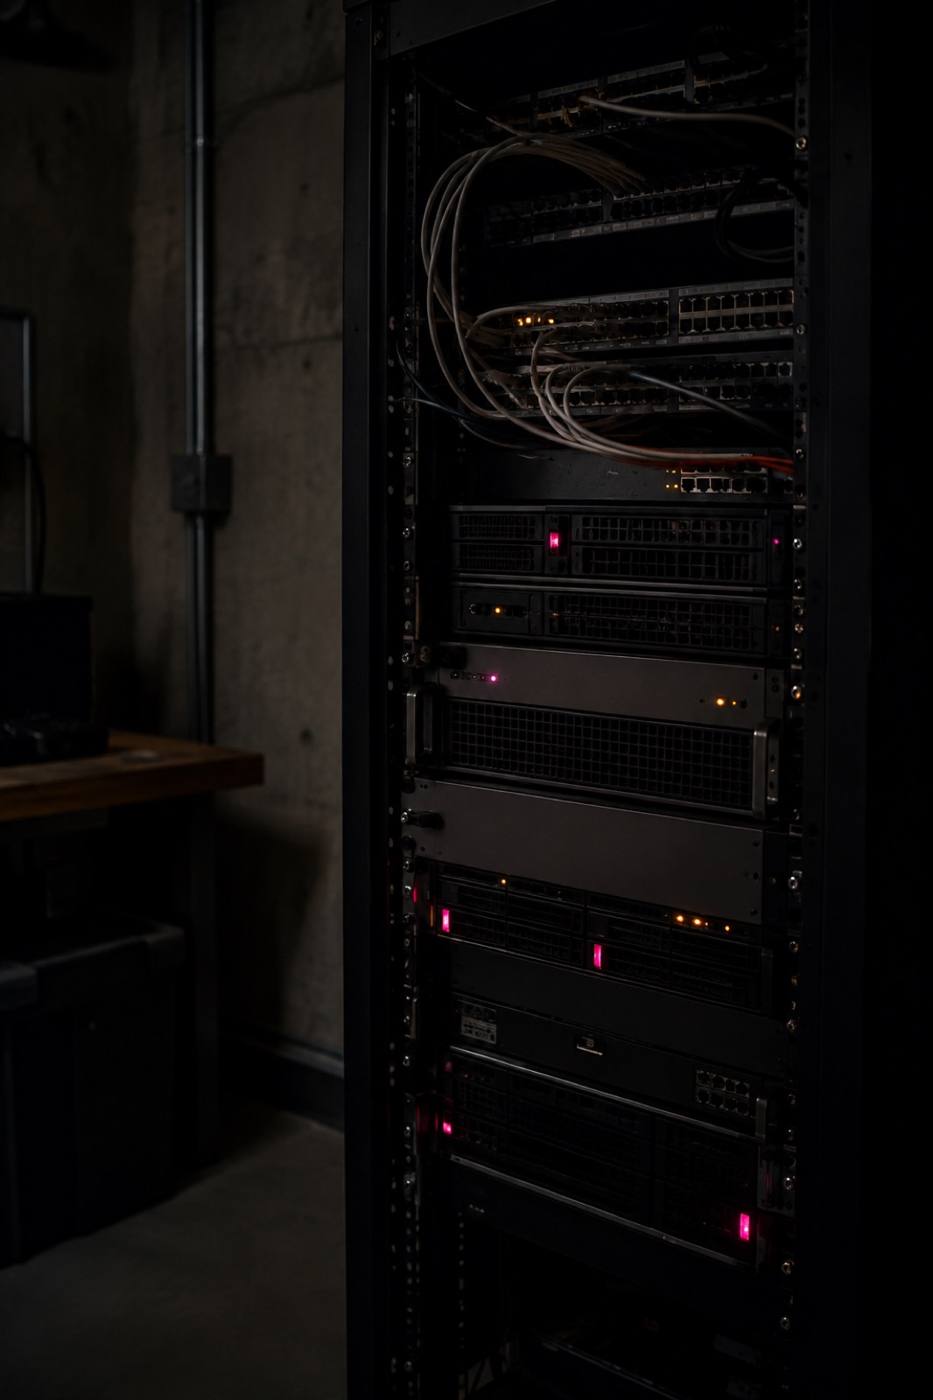
Traces and logs land in storage you already control. Self-hosted deployment means telemetry never leaves the network you built.
Uptime alerting listens for the pattern that matters, so when a service stops calling, you hear about it early.
$ curl -sSL https://nightjar.dev/install | sh
Points your OpenTelemetry collector at the Nightjar pipeline. Runs wherever you already run your services.

Get started
Install the SDK in your stack tonight, or tell us where to reach you and we will trace one of your own services with you.
Bring your hardest service to trace