Cinder Peak GeospatialFlagstaff, Arizona

Satellite · Drone · Ground survey · One dashboard

From 400 miles up to 4 inches down.

Integrated geospatial data for land managers. We capture imagery and survey measurements at every altitude, then bring them down to earth in one dashboard.

Cross-section — the altitude stack Fig. 01
  • 400 miSatellite imagery
  • 400 ftDrone capture
  • 4 inGround survey
  • One viewGIS dashboard

The altitude stack

Every altitude, one continuous dataset.

Each level answers a different question. Registered together, they answer the one your team is actually asking.

01 — Satellite · 400 miles

Orbit

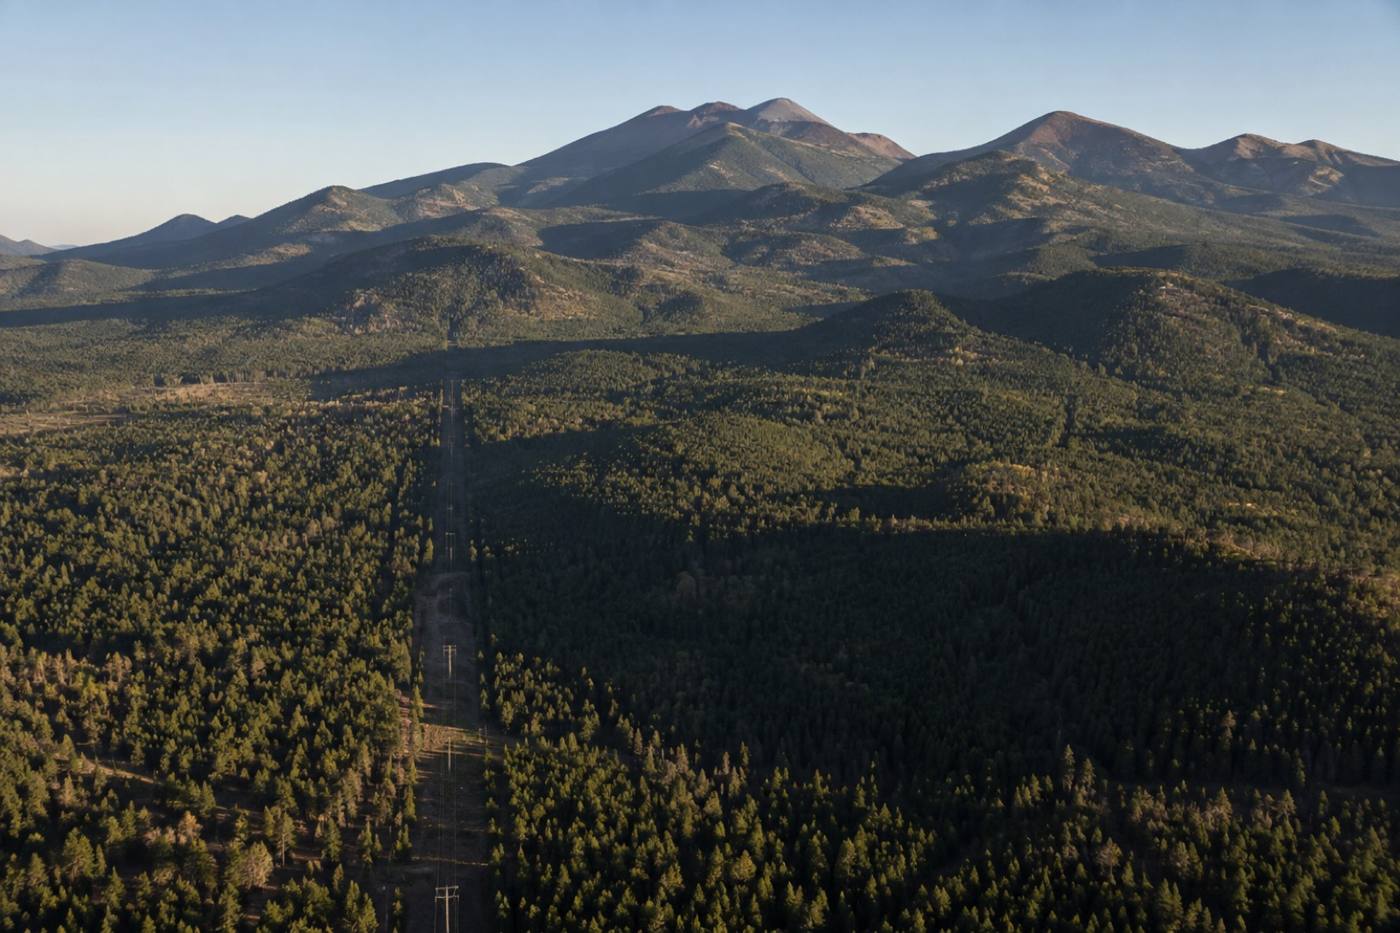
Wide-area imagery sets the baseline. We assemble satellite scenes into one consistent surface layer, so a fire scar, a new road cut or a completed thinning project reads as change — not noise.

  • Multispectral scene assembly
  • Change detection over time
  • Regional baselines
Aerial view of a mountain range with a cleared utility corridor running through forest
Baseline imagery — regional extentFig. 02

02 — Drone · 400 feet

Flight

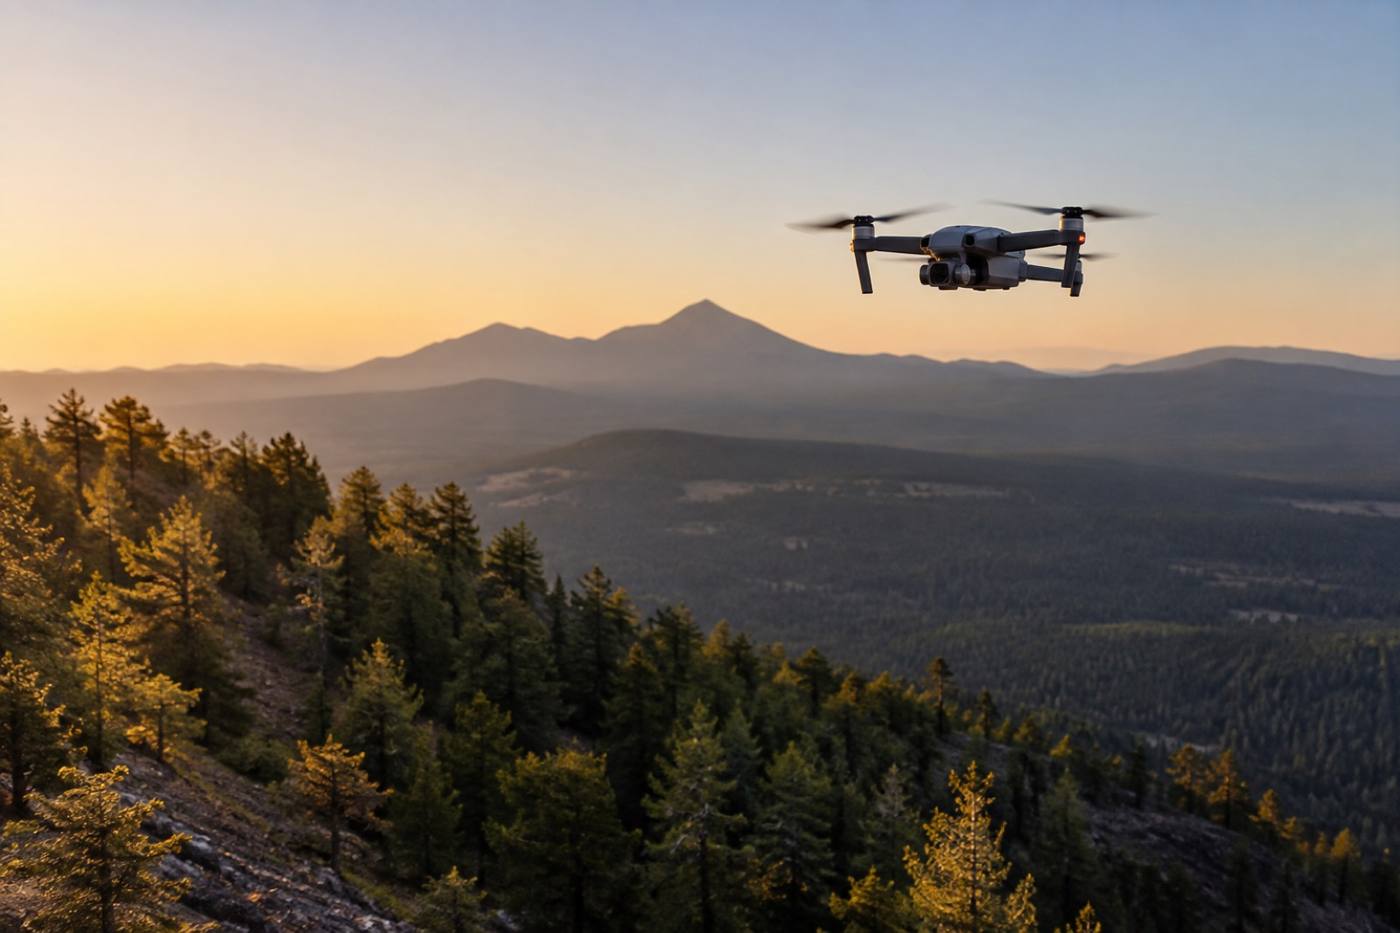
Where the satellite view is too coarse, we fly it. Drone capture gives us the resolution to see canopy gaps, culvert outlets and slope failures along a corridor — flown on your schedule, not the satellite's.

  • Orthomosaics and point clouds
  • Corridor and site capture
  • Repeatable flight lines
Survey drone in flight above a pine forested slope at dawn
Corridor capture — sub-meter detailFig. 03

03 — Ground survey · 4 inches

Ground

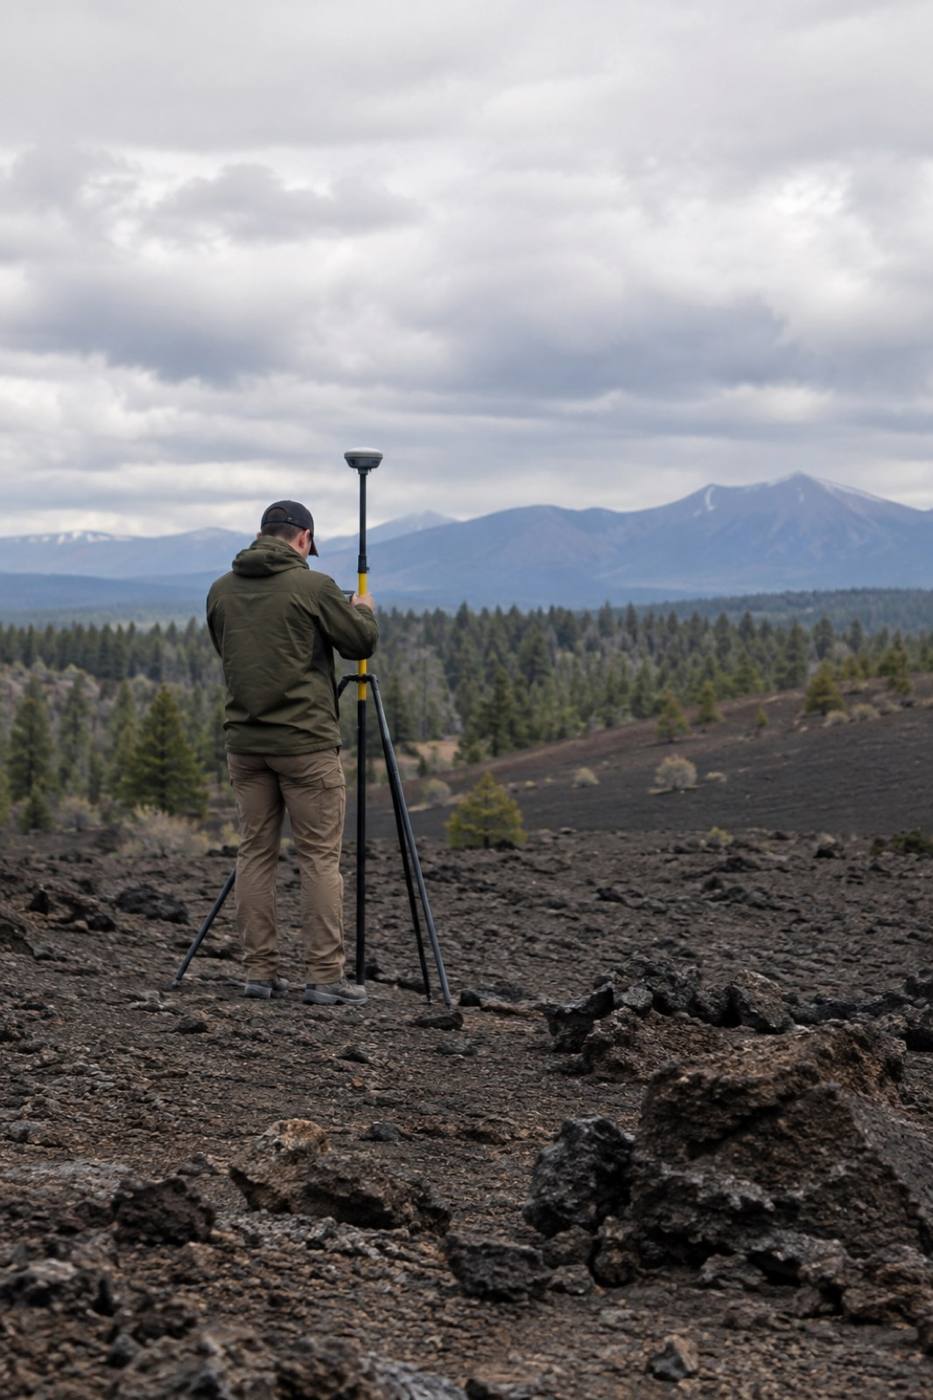
A crew on foot closes the last gap. Ground survey ties everything above it to real coordinates: control points, boundaries and the features that never show up from the air.

  • Control points and check shots
  • Boundary and feature capture
  • Field verification
Field surveyor working with a tripod-mounted GNSS receiver on a cinder field
Control points — field verificationFig. 04
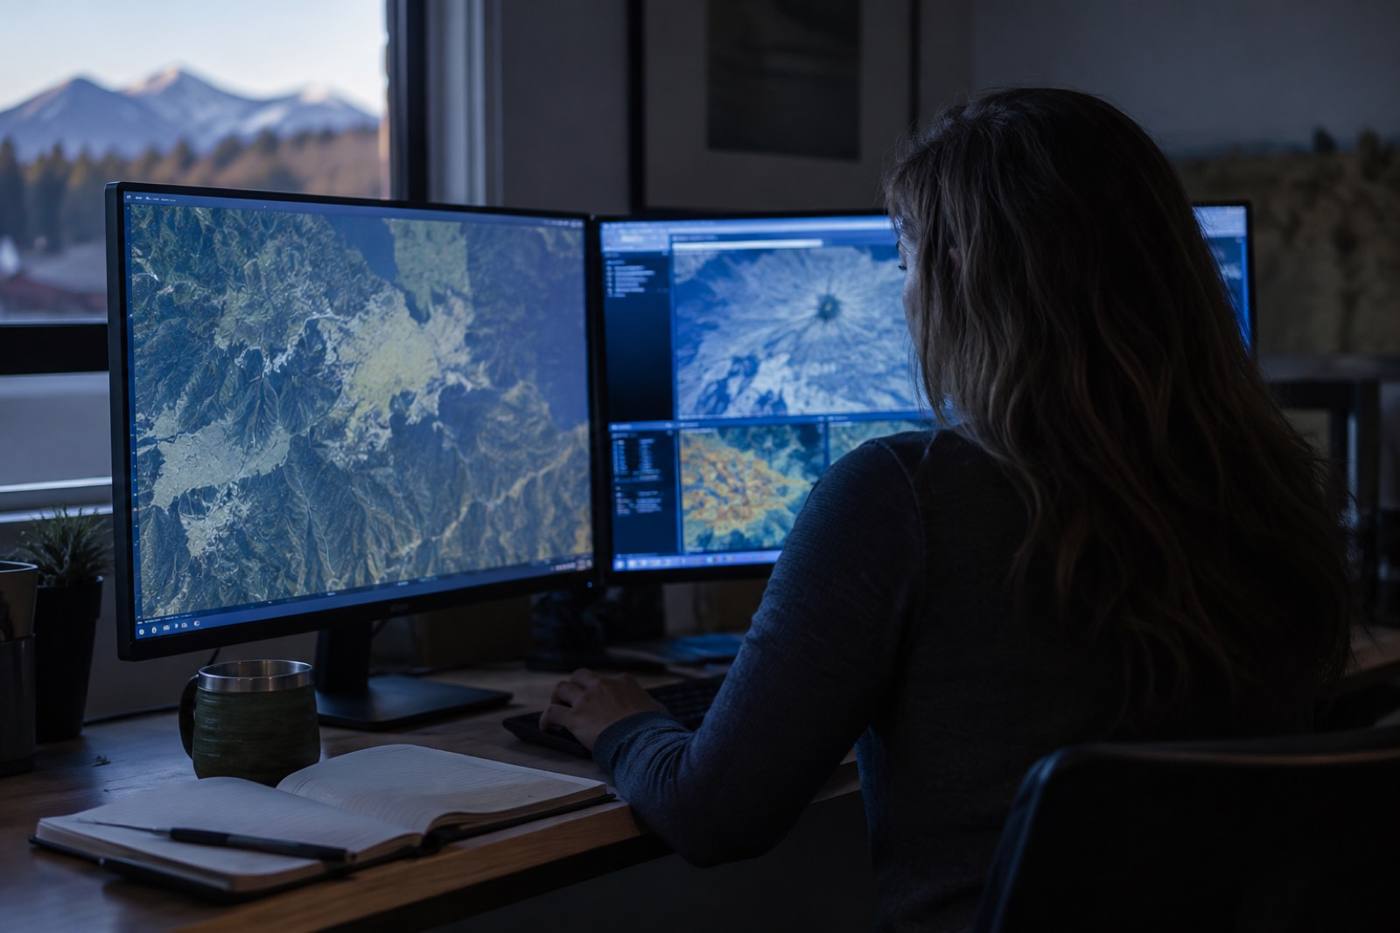
GIS analyst reviewing layered map imagery on large monitors in a dim office
Unified dashboard — one operating viewFig. 05

One operating view

All of it lands in one dashboard.

Layers, timelines and exports inside a GIS environment your team already knows how to use — built around the decisions you have to make and the systems you already run.

  • Custom layer stacks
  • Hosted or on your infrastructure
  • Exports your GIS already reads

Capabilities

Four ways we put altitude to work.

Each engagement is scoped to the decision in front of you, and to the accuracy that decision actually needs.

How it works

We capture at every altitude, then bring it down to earth.

Four stages, one thread of accuracy running from the first flight plan to the layer your team opens on a Monday morning.

01

Scope

We start with the decision you need to support, and the accuracy it demands.

02

Capture

Flight plans, satellite tasking and field crews scheduled around access and weather.

03

Process

Imagery is rectified, classified and checked against ground control before it ships.

04

Deliver

Layers, dashboards and exports handed over with the documentation your team needs to maintain them.

Request a briefing

Bring every altitude into one view.

Tell us what you are mapping and who has to use it. We will come back with an approach and the accuracy it can hold.

  • Based Flagstaff, Arizona
  • Works with Land managers and municipal GIS teams
  • Engagements On-site and remote

Start a conversation